Så läses marken
Två nationella karteringar, två vädertjänster, två fuktklockor och en uppsättning tröskelvärden per art. Det här är hela kedjan, från lasern som mätte din skog till färgen på kartan.
Sveriges mark, mätt på metern.
Lantmäteriet flög landet med flygburen laserskanning och publicerade resultatet öppet, under CC BY 4.0. Den pågående skogsskanningen lägger ut ett till två laserekon per kvadratmeter; de ekon som tar sig genom krontaket ner till marken är de som räknas, och de blir ett markmodellsrutnät på en meter. Det är formen på själva skogsmarken, mätt under träden i stället för avläst ovanpå dem.
Ur det höjdfältet härleder vi tre storheter, cell för cell:
- Slope
- Hur brant marken faller, vilket avgör hur länge regnet stannar där det landar.
- Aspect
- Åt vilket håll cellen vetter. En nordsida håller sin fukt genom en torr vecka; en sydsida tar solen och värms först.
- Topografisk väta
- Var vattnet samlas, utifrån hur mycket mark uppströms som dränerar in i en cell mot hur snabbt det dräneras ut igen.
De tre beskriver formen en flush följer: en fuktig, skyddad, nordlutande söm några meter bred, som löper längs en höjdkurva. På meterns skala är den sömmen något du kan gå till.
 Ett värde
Vad stationen levererar över hela scenen.
 Trettio meter
En global höjdmodell, som löser upp i block.
 En meter
Lutning, väderstreck och väta ur den nationella laserskanningen.
Vad som växer på den, cell för cell.
Naturvårdsverkets nationella marktäckedata täcker samma mark med krontak och skogstyp. Gran, tall, björk och blandbestånd, öppen våtmark, hygge — varje cell bär vad som står på den.
Lutning, väderstreck och väta säger vad en cell gör med vatten och ljus. Marktäcket säger vad som växer där. Multiplicera de två och du har artvis lämplighet: kantarell vill ha den fuktiga, mossiga granmarken och björkkanterna intill, vilket är en vätaavläsning och en täckeavläsning som är överens; blåbär vill ha den slutna gran och tall den faktiskt bär frukt under. En och samma sluttning bär därför fem olika poäng, och kartan ritar den du har valt högst upp på skärmen.
Höjdrutnätet är en meter; marktäcket är tio. Där de två möts görs habitatbedömningen på den grövre av dem — tio meter — medan lutningen, väderstrecket och vätan under den fortfarande är uträknade på den meter lasern mätte. Tio meter är ungefär bredden på den söm du ändå går längs.
Det är vad guldet på kartan betyder: mark vars form och täcke passar den här arten. Det är en habitatavläsning, som vilar på publicerade preferenser för varje art och på två nationella karteringar — en expertmodell, och märkt som en sådan.
Sjuttiotusen rutor, poängsatta en gång per art.
Sveriges höjdmodell är alldeles för stor för att hållas i ett stycke, så Lantmäteriet publicerar den så som den måste hanteras — som rutor. Varje ruta täcker 2,5 gånger 2,5 kilometer och rymmer 6,25 miljoner markceller, levererad som en molnoptimerad GeoTIFF i EPSG:5845 via ett STAC-API som vem som helst kan fråga. Att täcka landet tar i storleksordningen sjuttiotusen av dem.
Vi arbetar oss igenom dem en i taget. En ruta hämtas ner, lämnar ifrån sig sin lutning, sitt väderstreck och sin topografiska väta, möter marktäcket för samma mark, och går tillbaka upp som en färdigberäknad lämplighetsyta. Sedan nästa.
2.5 × 2.5 km
En ruta i det nationella rutnätet
6 250 000
Markceller inuti den
~70 000
Rutor för att täcka Sverige
Och poängsättningen körs en gång per art, vilket är det som är värt att säga långsamt. Kantarell vill ha fuktig, mossig, nordlutande granmark. Lingon vill ha den torra, öppna, väldränerade tallen på andra sidan samma kulle. Det är olika sluttningar, så de får olika ytor — fem arter är fem raster, vart och ett beräknat för sig, och kartan ritar det du har valt högst upp på skärmen.
Att göra det arbetet i förväg är det som håller det snabbt i skogen. Tungjobbet är klart långt innan du öppnar appen; telefonen hämtar den lilla förberäknade rutan för marken du står på och multiplicerar den med veckans förhållanden. Räkneoperationen som blir kvar åt telefonen är en multiplikation.
Vädret ger dig veckan. Marken ger dig sluttningen.
Förhållandena kommer från närmaste aktiva SMHI-station, namngiven på skärmen, så att du ser vilken station din prognos står på och hur långt bort den ligger. Graddagar, nederbörd och lufttryck kommer från det observationsnätet. MET Norway levererar tiodagarsprognosen ovanpå, temperatur och nederbörd framskrivna dag för dag.
Över de två kilometrarna ravin i bilderna ovan är den väderindatan i praktiken ett enda värde. Den blöta nordsidan, ravinbotten och den torra sydsluttningen delar samma regn och samma värme i modellen.
Vilket är precis därför terränglagret förtjänar sin plats. Vädret säger vilken vecka som är värd att ta. Marken säger vilken sida av dalen du ska gå när du väl är där.
Regnet går på två klockor.
Regnet gör två skilda jobb med veckors mellanrum, så modellen håller två fuktfönster och kör dem var för sig. Båda syns på skärmen.
- Utlösarfönster · veckor
- Om marken har lagrat tillräckligt med fukt för att bära frukt alls den här säsongen. Besvaras av veckors ackumulerat regn, det mesta redan avgjort när du tittar.
- Expansionsfönster · dagar
- Om fruktkropparna är uppe nu. Besvaras av de senaste dygnens värme och väta, och det är det som rör sig mellan torsdag och lördag.
Att dela på dem är det som gör att en vecka kan läsas som laddad och tyst på samma gång: en stark utlösare med mjuk expansion betyder att marken är laddad och väntar på nästa regn. Det är veckan att hålla ögonen på remsan, och morgonen efter regnet att ge sig ut.
Båda klockorna tröskelsätts mot lokal klimatologi i stället för mot en nationell konstant, eftersom Sverige spänner över två klimatregimer — ”blött för Skåne i september” och ”blött för Norrbotten i september” är olika mängder vatten, och det är percentilen som gör att samma art läses vettigt i båda.
Fem arter, och varifrån varje tröskelvärde kommer.
Ett tröskelvärde är siffran som avgör när ”tillräckligt fuktigt” är tillräckligt fuktigt för en viss art. Varifrån den siffran kommer varierar, och du ser alltid vilken sort du har framför dig.
Blåbär · Blåbär
Vaccinium myrtillus
Svenska dataTröskelvärden anpassade efter svenska observationer.
Lingon · Lingon
Vaccinium vitis-idaea
Svenska dataTröskelvärden anpassade efter svenska observationer.
Kantarell · Kantarell
Cantharellus cibarius
Publicerade tröskelvärden, jämförbara nordliga skogar · omjustering mot skånsk mark
Karljohan · Karljohan
Boletus edulis
Publicerade tröskelvärden, jämförbara nordliga skogar · omjustering mot skånsk mark
Trattkantarell · Trattkantarell
Craterellus tubaeformis
Publicerade tröskelvärden, jämförbara nordliga skogar · omjustering mot skånsk mark
Blåbär och lingon går på svenska data. Kantarell, karljohan och trattkantarell går på publicerade tröskelvärden från jämförbara nordliga skogar, och justeras om mot skånsk mark den här säsongen — och varje avläsning bär sin egen etikett, så du vet alltid vilken av de två du håller i. Säsong ett-anteckningarna från Skåne och Blekinge är det som flyttar svamptrion mot den första gruppen.
Förhållanden × terräng, och konfidensen följer den svagare av dem.
signal = conditions ⊗ terrain
Ett viktat geometriskt medelvärde med lika vikt — en nödvändig OCH-koppling, där den starka avläsningen kräver båda halvorna.
De två sidorna multipliceras i stället för att medelvärdesbildas, vilket är det som gör att den starka avläsningen betyder något. Bästa mark under en torr vecka läses lågt och förblir lågt. En perfekt vecka över mark som passar någon annan art läses också lågt. Guld på kartan plus en bra vecka på remsan är läget värt att köra för, och det är läget kopplingen är byggd för att isolera.
Konfidensen sätts samman på samma sätt och tar värdet av den svagaste indatan bakom sig. En välkarterad cell läst mot en station som rapporterade i morse läses som säker. Samma cell läst mot en station vars senaste rapport var på tisdagen läses med tisdagens konfidens, och du ser vilken av de två du har. Siffran bär åldern på det tunnaste som ligger under den.
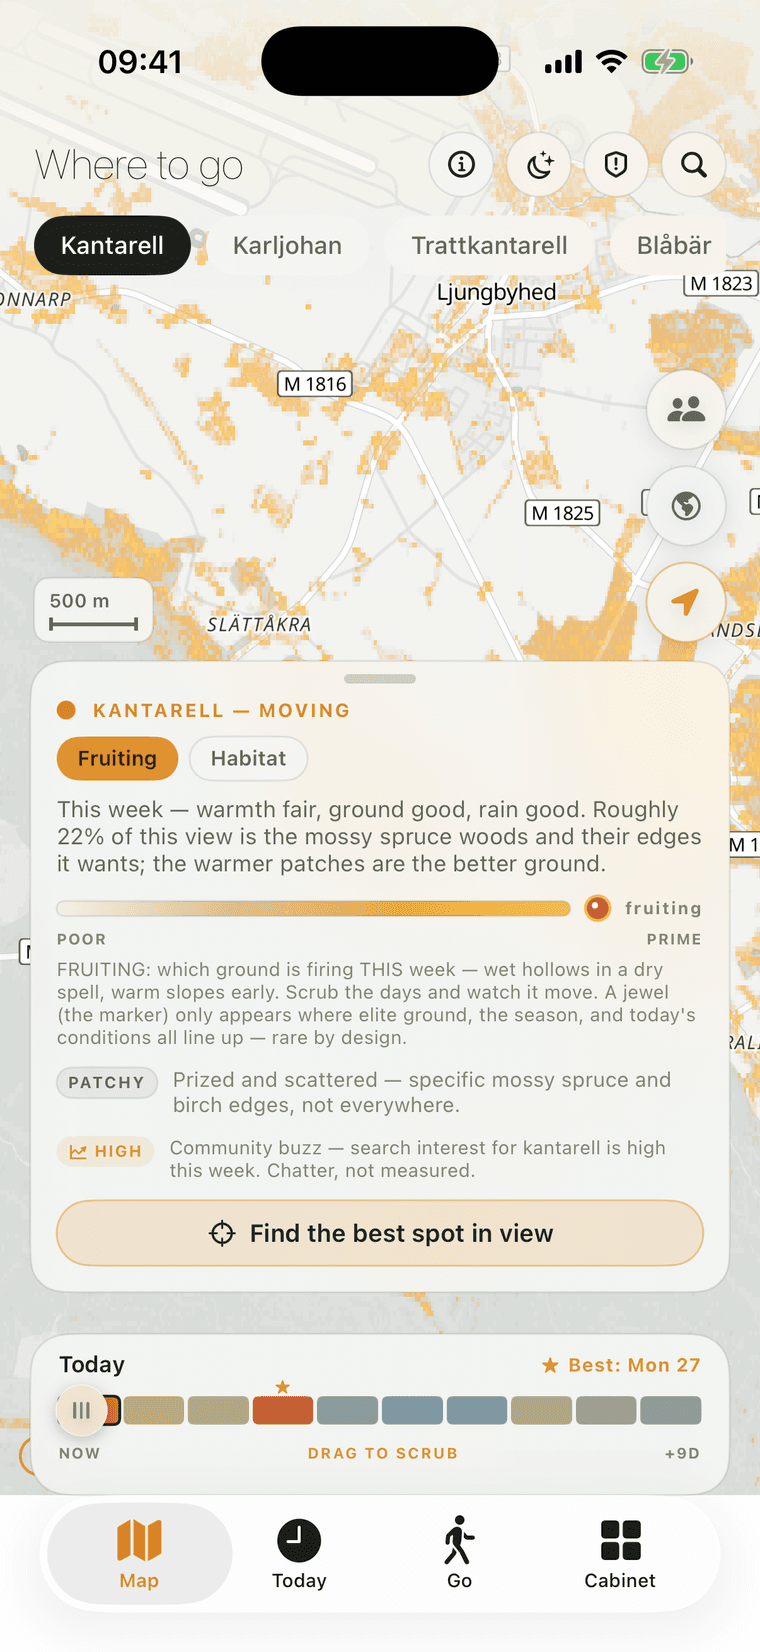
Terränglagret ovanpå riktig kartografi, poängsatt för kantarell. Ungefär en femtedel av den här vyn är den mossiga gran- och björkkant arten vill ha, och de varmare fläckarna är den bättre marken inom den.
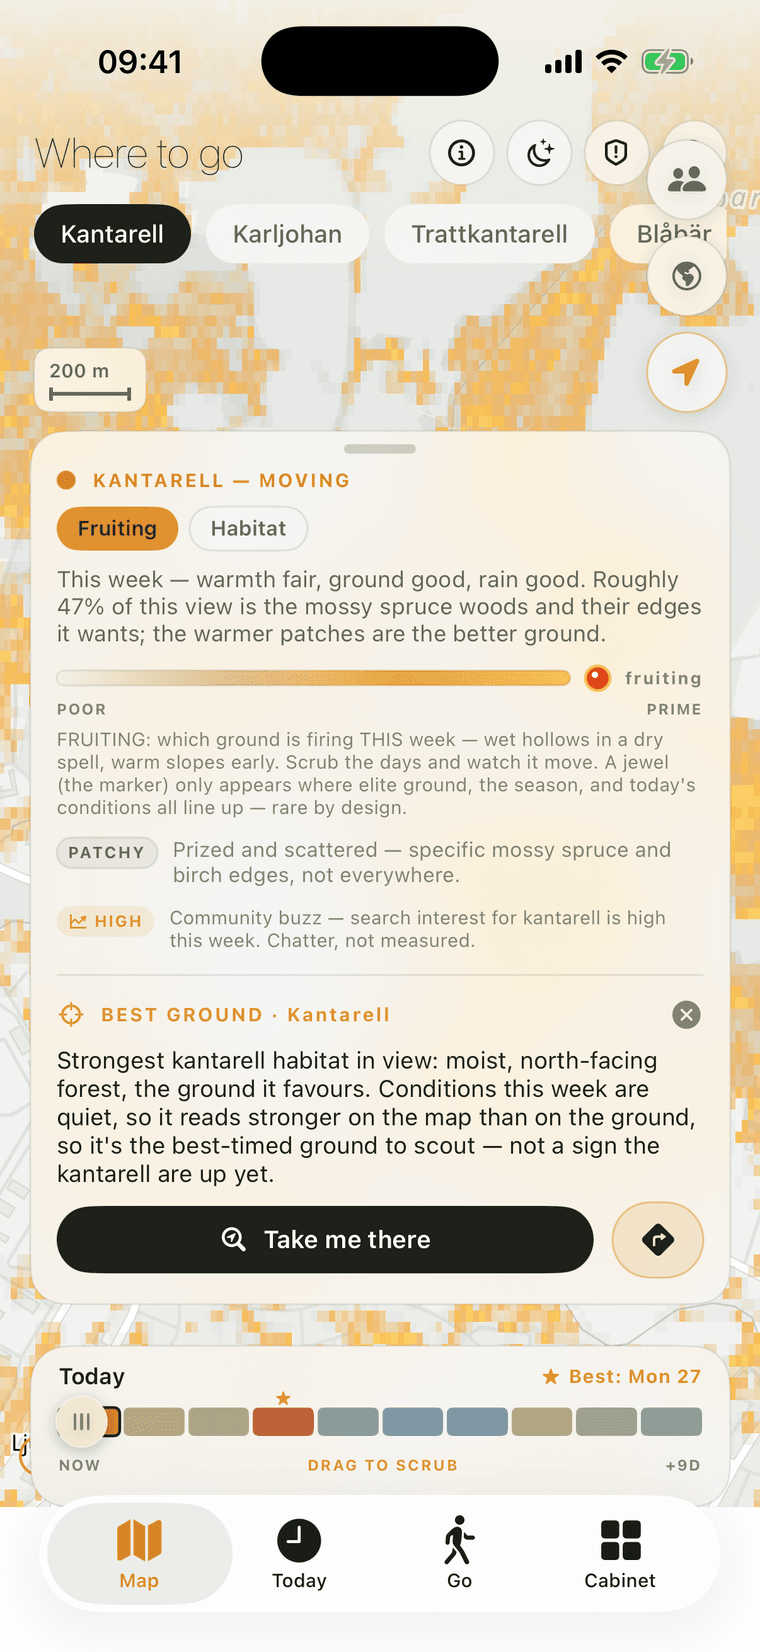
Kopplingen, uttryckt i ord på skärmen: det starkaste habitatet i vyn, fuktigt och nordvänt, med veckans förhållanden tysta — så det ges till dig som marken med bäst tajming att speja på, och tiodagarsremsan pekar på måndag.
Gå och kolla själv.
Varje datamängd som nämns här är offentlig, och det mesta är gratis. Det här är platserna siffrorna ovan kommer ifrån, så att du kan läsa specifikationerna själv.
- Markhöjdmodell NedladdningLantmäteriets nationella markhöjdmodell — rutnätet på 1 m, CC BY 4.0.
- Lantmäteriet STAC APISjälva den levande rutkatalogen. Rutans utbredning, projektionen och licensen finns alla i JSON-filen.
- Laserdata Nedladdning, skogSkogslaserskanningen från 2018 och framåt, med en till två punkter per kvadratmeter.
- Nationella MarktäckedataNaturvårdsverkets nationella marktäckedata, raster på 10 m, publicerad som öppna data.
- SMHI öppna dataObservationsnätet som närmaste aktiva station kommer från.
- MET Norway LocationforecastTiodagarsprognosens API, och dess användarvillkor.
Journalen bär vetenskapen under allt det här — varför nordsluttningen går först, vad regnet faktiskt gör på två tidsskalor, och folkreglerna tagna på tillräckligt stort allvar för att modelleras.